by Soontaek Lim
Share
by Soontaek Lim

In the realm of data analysis, Pandas is widely acclaimed for its convenience and efficiency. Yet, like with any tool, mastery over its use is essential to unleash its full potential. Today, I want to share a scenario from a past project of mine, illustrating a common challenge when handling large datasets with Pandas: performance issues, and the journey towards resolving them.
During the early stages of the project, everything seemed smooth. Unit tests with small datasets revealed no problems. The code functioned well, and the analytical outcomes were as expected. However, as the project progressed to handling larger datasets, performance issues began to emerge conspicuously.
The analysis tasks started taking much longer than anticipated, occasionally consuming excessive system resources. This significantly slowed our project’s momentum, making it clear that we needed to diagnose and resolve the underlying performance bottlenecks.
Profiling the code using Snakeviz
In the quest to enhance application performance, identifying the root causes of slowdowns is crucial. That’s where profiling comes into play, and for Python applications, cProfile is a go-to choice for many developers. While cProfile is powerful, it presents results in a text format, which can be cumbersome to navigate as the complexity of the code increases.

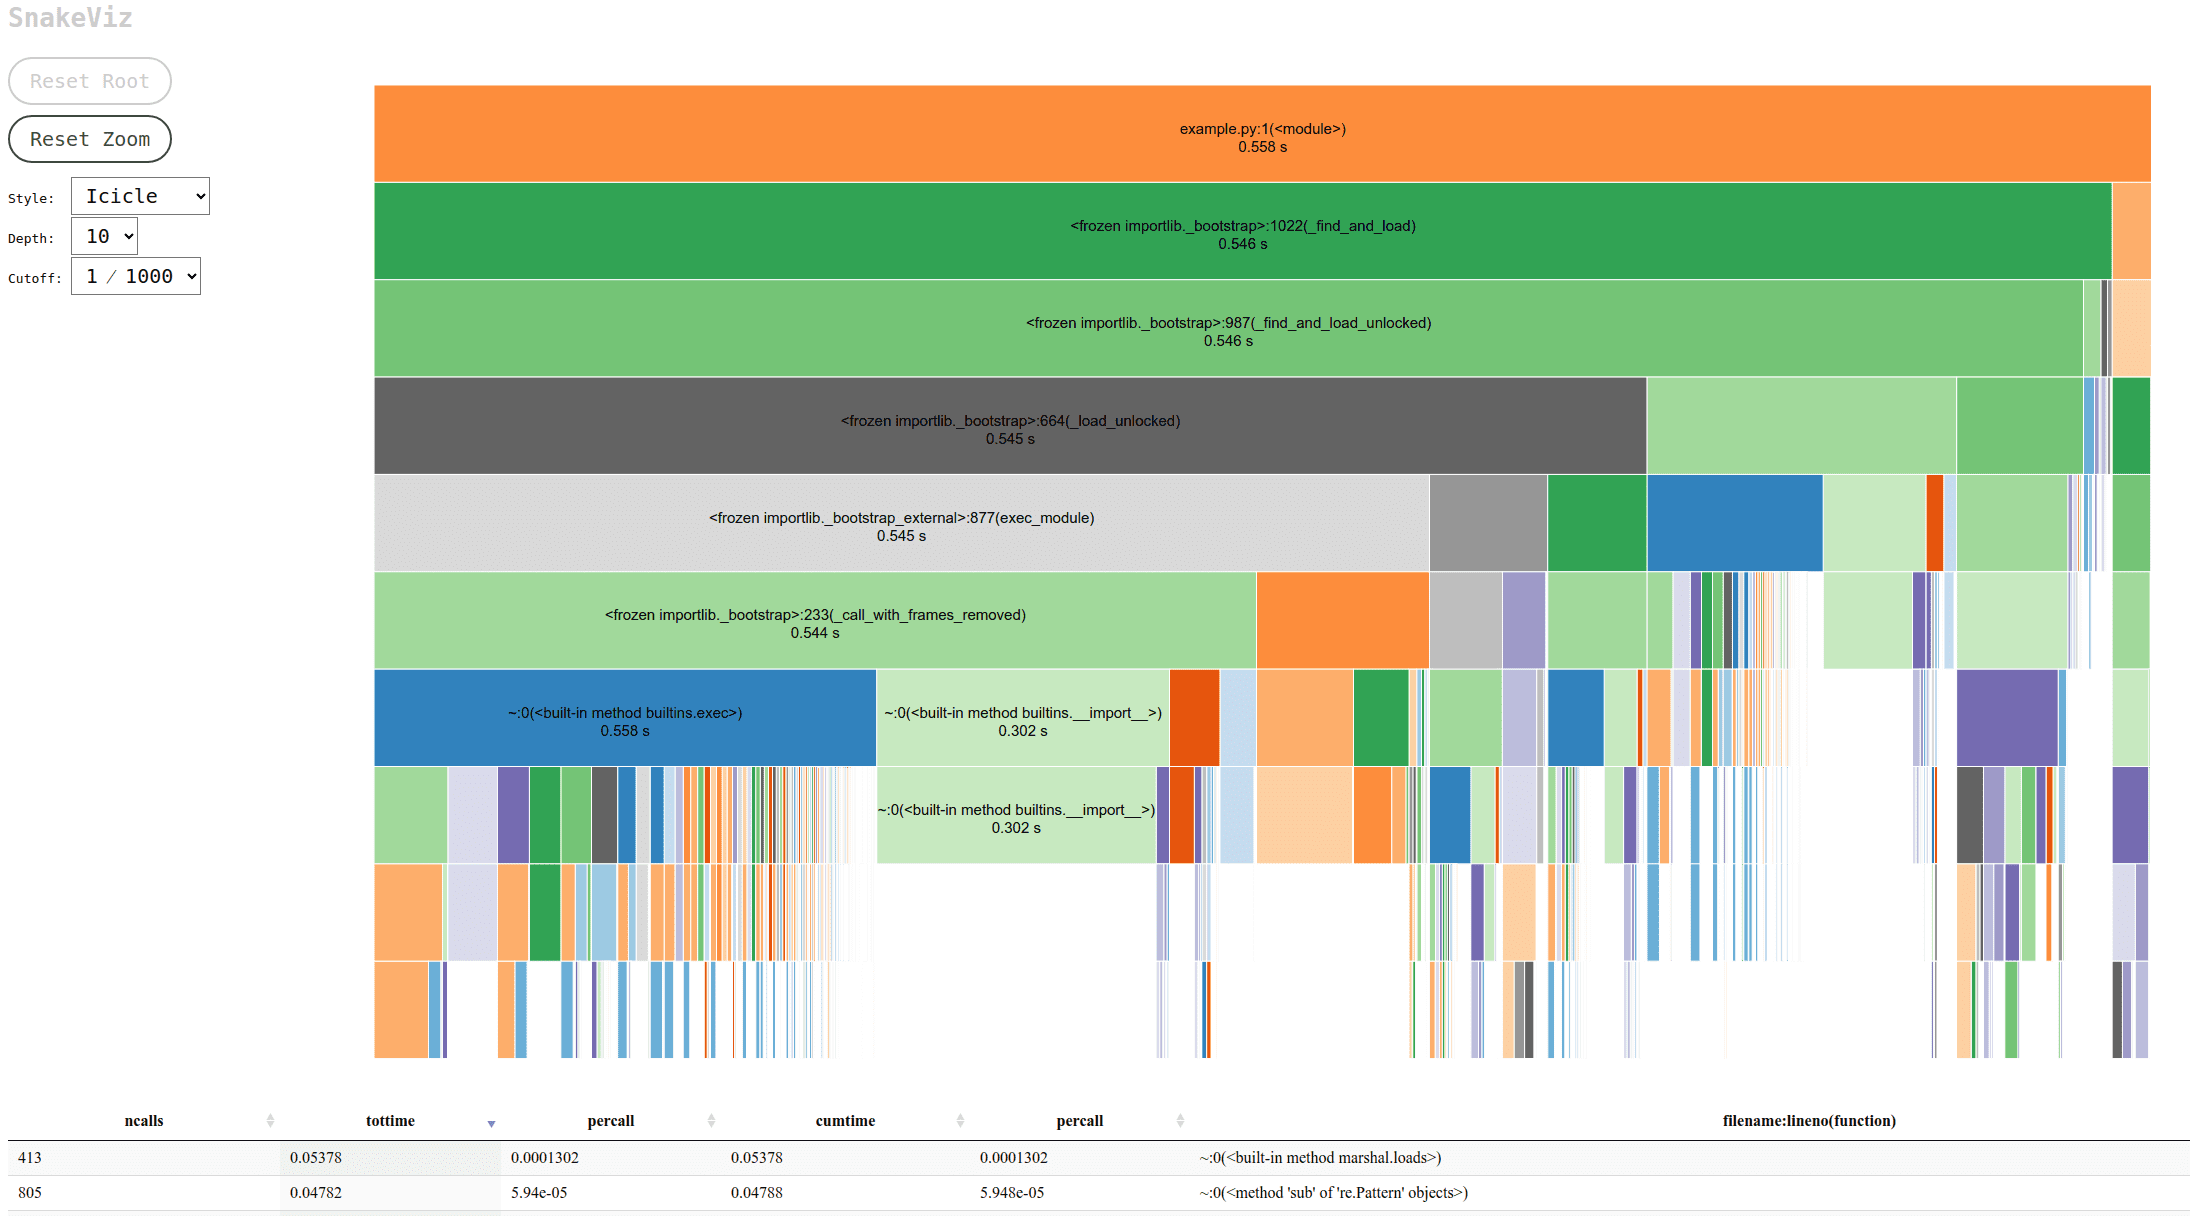
Snakeviz transforms the profiling data from cProfile into an interactive visual representation in your web browser. The default Icicle visualization style offers a clear, hierarchical view of call stacks, showing exactly how much time each function call takes. By clicking on the rectangular blocks representing function calls, users can zoom in to focus on specific calls, making it easier to pinpoint which lines of code are the most time-consuming.

This visualization capability led to the discovery of a significant bottleneck in the project. The culprit was the process of adding rows to a Pandas DataFrame inside a For-Loop using the append() function. Pandas, an open-source library designed for easy data analysis and manipulation in Python, is widely used for its powerful features. However, using append() in this manner is costly due to its impact on DataFrame indexes. Consequently, it is advised to avoid append() in loops and use concat() instead to add rows to DataFrames.


To illustrate the difference, consider the time it takes to add 100,000 rows using both methods: append() took 283 seconds, while concat() completed the task in just 1.33 seconds. This stark contrast underscores the efficiency of concat() and well-known issue in Pandas. append() is deprecated in Pandas version 2.0 and above.
Profiling not only saved considerable processing time but also highlighted the importance of efficient memory management. Memory profiling, another critical aspect of optimizing big data processing, can lead to significant savings. This experience teaches that thorough testing with adequate datasets and profiling is essential, as some issues are beyond the reach of unit tests alone. Efficient time and memory management are paramount in big data processing, and tools like Snakeviz, etc. play a vital role in achieving these goals.


